
Prompt tracking for AEO: the four numbers a marketing team can defend
As of November 2026, AEO prompt tracking is the only way to know whether your brand is in the answer when a buyer asks ChatGPT, Perplexity or Google AI Overviews a buying question, because rank tracking records a position, not a presence. Fix the prompt list, run it every week, and keep four numbers on one page: presence rate, citation frequency, share of voice and description accuracy. Most Singapore teams start by comparing what a geo agency in singapore charges against the hours an in-house run would take, and that comparison only makes sense once the four numbers and their denominators are fixed.
Key takeaways
- Rank tracking answers "where is my page"; prompt tracking answers "is my brand in the answer, and how was it described". They are different instrumentation, not two views of one report.
- A workable library starts at 20 to 100 prompts per brand; a running programme executes 50 to 200 prompts weekly across engines.
- Presence and share of voice are not interchangeable. Presence measures whether you appear; share of voice measures whether you are winning the comparison.
- Version control is the whole game. Change the question, engine, language or region between periods and the improvement is manufactured.
- Budget for a named owner of the prompt list and of the report's caveats. Without that owner, the numbers drift within two months.
How prompt tracking differs from AEO rank tracking: which metrics to own
A rank tracker's unit is a keyword-to-URL position on one search engine. A prompt tracker's unit is a question asked to several answer engines, with a record of what came back: which brands were named, which URLs were cited, and in what language the answer described you.
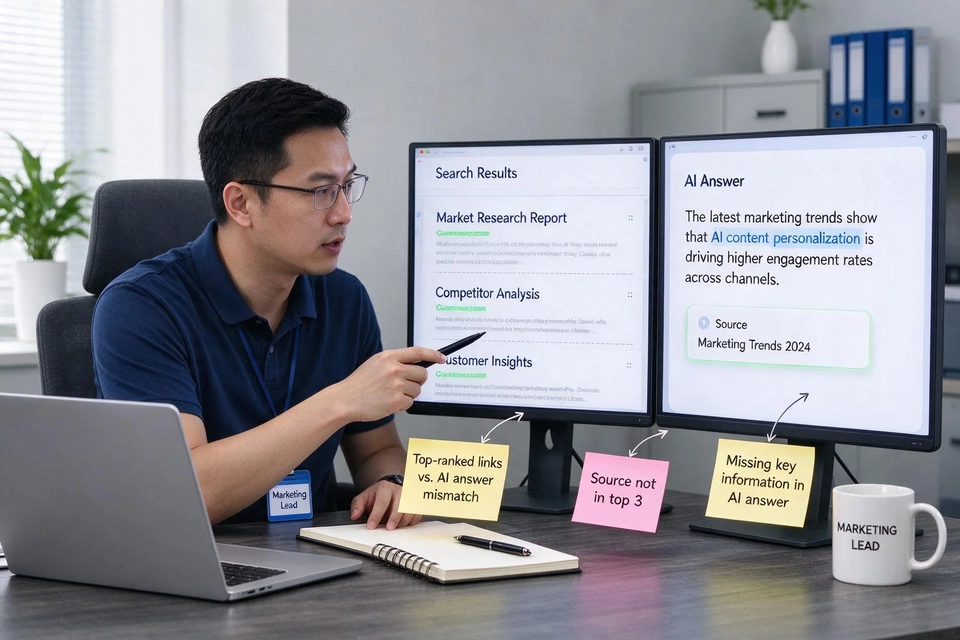
The practical difference for a marketing lead is where the evidence sits. A page that sits at position eight on Google can still be the first source quoted in an AI Overview for a shortlisting question, and a page at position one can be skipped entirely because a competitor's comparison page is easier for the model to retrieve. Neither outcome shows up in a rank export.
This is where most reporting breaks. Search Console data and rank exports are fitted together into one dashboard, and the AI layer either gets folded into organic traffic or omitted. The reader of that dashboard then cannot see the questions Singapore buyers actually type, which are rarely the keywords in the account.
The four numbers a marketing team can defend
Pick the metrics by what they prove, then keep the calculation on the page so nobody re-derives it in a different way.
| Metric | What it answers | Worked example from the sources | What it does not prove |
|---|---|---|---|
| Presence rate | Are we in the answer at all? | 28% brand presence rate: the brand appears in 28% of the tested answers | Whether the mention was accurate or favourable |
| Citation frequency | How often is one of our URLs pulled in? | 20% citation frequency: one of the brand's URLs is cited in 20% of tracked prompts | Whether the click reached us |
| Share of voice | Are we winning against the named alternatives? | 20% share of voice against 15% on a larger competitive field | Whether the answer was positive |
| Description accuracy | Do engines describe us the way we position ourselves? | Requires reading the answer text, not a counter | Anything about volume of demand |
Read the citation frequency row first. It is the number that most often gets inflated, because a team counts every answer where its domain appeared anywhere in the retrieval set, including sources the user never sees. Report visible citations separately from retrieved sources, or the figure looks healthier than the answer the buyer received.
Share of voice needs its denominator stated out loud. The two published worked examples give a 20% and a 15% result on different bases, one with a total of 100 brand mentions and one with 200, so the same formula describes two different competitive fields. Put the total in the column header of the report, not in a footnote.
How to build the prompt library
The library is the asset. A flat list of questions that nobody reviews produces a report that reads like a survey of the marketing team's own assumptions.
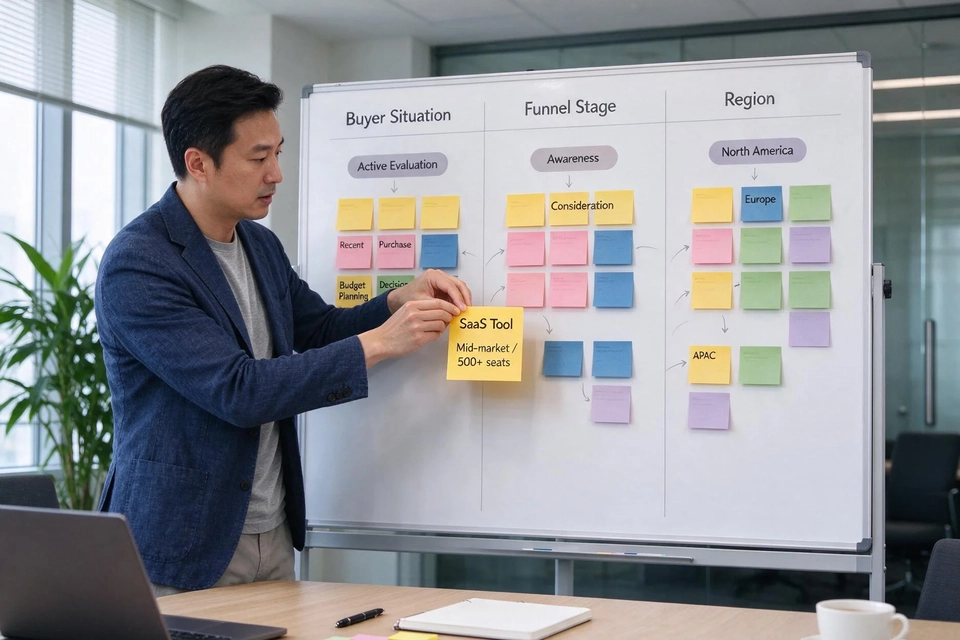
- Start from buyer situations, not brand names. Collect the comparison and shortlisting questions your sales team was asked in the last quarter: supplier selection, plan comparison, cost and preparation. Those phrasings are the closest thing to what a buyer types into an engine.
- Set the starting size. Plan for at least 20 to 100 prompts per brand as a starting point, spread across awareness, consideration and decision stages.
- Cluster before you grow. Group prompts by topic, intent and region so the report can be cut by funnel stage and by market rather than read as one total.
- Split question-led from brand-led. A prompt that names your brand tests how engines describe you to people who already know you; an unbranded prompt tests discovery. Mixing them in one average hides both results.
- Fix the weekly load. In practice this looks like running a set of 50 to 200 prompts weekly across the chosen engines, which is where tooling or a managed service replaces a spreadsheet.
For a Singapore business, region tagging matters more than teams expect. A question asked with a Singapore frame and the same question asked generally can return different sources and different competitors, so the two belong in separate clusters even when the wording is nearly identical.
Closing the reporting loopholes
Every number in the table can be moved without any real gain, and each move looks like work: rewrite the question so it now names your brand, swap a difficult engine for an easier one, translate the prompt into a phrasing that favours you, or compare this quarter's longer list against last quarter's shorter one.
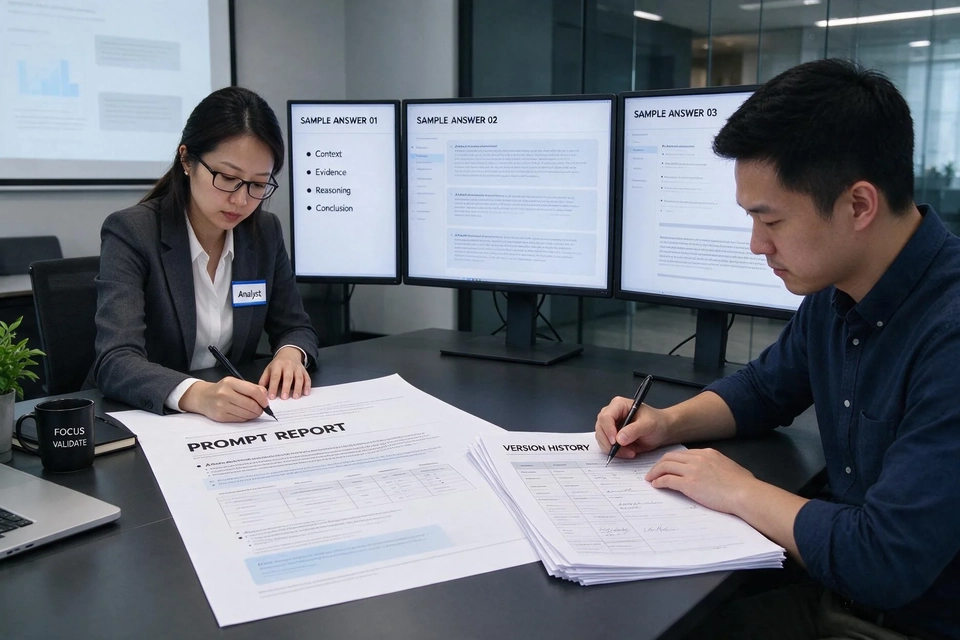
The defence is a fixed observation protocol. Freeze the question version, engine, language, region and sampling cadence for the whole comparison period, publish the sample size and failure count next to the result, and keep the history of any question you replace so the old and new periods stay honest.
Keep the brand-led samples in their own bucket for the same reason. If brand-name prompts sit inside the same average as category prompts, the presence rate rises without any change in how engines treat your content.
In-house or managed: who does this work
The decision is less about capability than about continuity. An in-house team can build the library from call notes and support tickets, but maintaining weekly sampling across three engines, keeping versions, and writing the report usually lands on the person already running SEO and paid search.
Three questions separate a real provider from a reporting vendor. Ask for the active prompt list with the buyer situations it came from, not a category list. Ask how questions are versioned when one is replaced. Ask what happens when an engine's coverage is thin, because a provider that reports a missing adapter as a zero is giving you a number you cannot compare.
If you are hiring, look at a geo agency in singapore that will show the raw answers behind the scores and put the sampling conditions in writing. A second opinion from another geo agency singapore team is cheap before the contract and expensive to run in parallel later. The brief you send that agency should already name the engines, the language and the month you want compared, because those are the terms that change what a monitoring quote covers.
Topkee's view: tracking starts from the buyer's question
Topkee runs prompt tracking inside its GEO service, as the first of six components rather than a standalone dashboard. The workflow takes real buyer questions, samples them on the agreed AI engines through API environments, and records whether the brand appeared and how it was described. The three analysis lines that follow, query fan-out, sentiment and description, competitor comparison and AI browsing, are built on that same question list, and the monthly knowledge content is mapped one article to one buyer question.
The part worth copying into any internal process is the counting rule. On the Topkee GEO plans the entry, standard and enterprise tiers differ by their active question caps, and those caps are simultaneously active questions rather than monthly execution counts, so running one question on three engines does not count as three questions. A question phrased in another language is managed as a separate question, and a replaced question keeps its version history so period comparisons stay valid. Those rules exist because without them a report can show growth that no buyer experienced.
Equally, the report states its own limits: engines are sampled through APIs and are not identical to what every consumer-version user sees, some adapters do not return citation or fan-out data, and no plan guarantees an AI recommendation or fixed exposure. Read how AI visibility differs from search rankings before you set targets on either metric, since the two move for different reasons.
Two weeks to your first prompt report
Weeks one and two are enough for a baseline if you stop expanding the list. Pull the last quarter of sales questions, keep the recurring ones, tag them by funnel stage and register them in a versioned sheet with the engine, language, region and date of each run. Then run the same set twice before drawing a conclusion, and write the report with the sample count and a note on what the data cannot show. A geo agency singapore partner will often hand you this register already tagged, which is one reason a managed baseline can land faster than an in-house one.
For context on where answer-engine advertising sits alongside this, the AI answer ad counts in apparel and electronics are a useful reminder that paid and organic presence in the same answers are separate budgets and separate reports.
FAQ
What is AEO prompt tracking?
It is the practice of asking a fixed set of buyer questions to several answer engines on a schedule and recording whether your brand, content or URLs appeared in each answer and how they were described. It measures presence inside answers, not a rank position. A geo agency in singapore usually runs this as a monthly service rather than one-off audits.
How many prompts do we need to start?
A starting point of at least 20 to 100 prompts per brand, then a weekly running set of 50 to 200 across the chosen engines. Start smaller and stable rather than large and unreviewed.
How do we calculate share of voice in AI answers?
Divide your brand mentions by the total brand mentions across the tracked prompts, then multiply by 100. If 20 of 100 mentions are yours, that is a 20% share of voice. State the denominator with the result.
Can we run prompt tracking without a tool?
Yes for a baseline: a versioned sheet, a weekly manual run of the same questions and a fixed record format. The manual route becomes hard to sustain once you add engines, languages and a monthly comparison, which is when teams move to a managed service or a tool, or hand the register to a geo agency singapore team.
What should a prompt monitoring report contain?
The monitoring period, the question version, the engines, the sample size and the failure count, then brand mentions, description tendency, competitor and source performance. Keep the answer evidence for the questions that changed most.
Sources
- Justina Thompson, "Prompt tracking for AEO: A guide for marketing teams", HubSpot Blog, 2026-11-11. https://blog.hubspot.com/marketing/aeo-prompt-tracking
- "AEO Tools to Track & Improve Your AI Visibility", HubSpot, 2026. https://www.hubspot.com/products/aeo
- "How to Measure AI Search Brand Visibility | 2026", work-management.org, 2026. https://work-management.org/marketing/measure-brand-visibility-ai-search/